Choose Your Own Vector Map

There are adults out there driving who were born after Google Earth came out. Potentially distressing facts aside, those who were around to remember the magic of scrolling in and out with infinite levels of detail was an experience that burned into our brains. Perhaps still curious 21 years later, [Craig Kochis] dove into how vector maps work by implementing one himself.
Some standard helper functions convert latitude and longitude into Mercator coordinates (x and y coordinates on the screen). He used WebGL to draw a canvas, making the whole thing interactive on the webpage itself. The camera position and zoom level stored as a matrix that is used to transform the map projection. By grabbing polygons that describe the shape of various borders and then converting those polygons into triangles with earcut, [Craig] has a part of a country rendered to a screen.
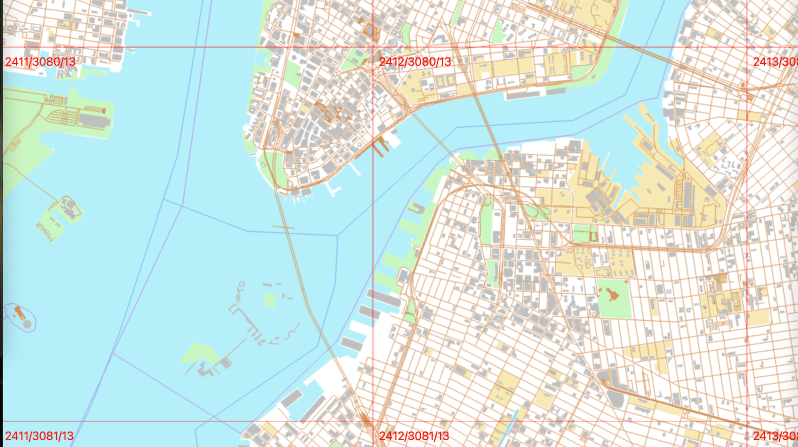
Where it gets interesting is the tiling system. As he zooms in and out, he wants to load in different levels of detail for each tile. He determines what tiles are in view and switches between them accordingly. The tiles come from a vector tile server [Craig] wrote earlier that can serve up tiles from OpenStreetMap data. In a relatively small amount of code, he had a passable map solution that could zoom and pan around to your heart’s content. Passable doesn’t mean good, so he does all sorts of optimization for WebGL, web workers, filling in missing data, and caching tiles.
The code is up on his GitHub, and it’s just an incredible little journey into some of the techs that powers the way most of us get around the world. This gorgeous laser-cut map might fit the bill nicely if you’re looking for map data used in a more real-world setting.
Post a Comment