Serial Studio: Easily Visualise And Log Serial Data
Outputting data from a microcontroller over a serial port is convenient and easy, but formatting, visualizing, and analyzing the data can be tedious and frustrating. [Alex Spataru] knows this all too well, having spent too many hours building and debugging custom dashboards. To save himself and others the same frustration in the future, he created Serial Studio, a tool for quickly building dashboards for serial data.
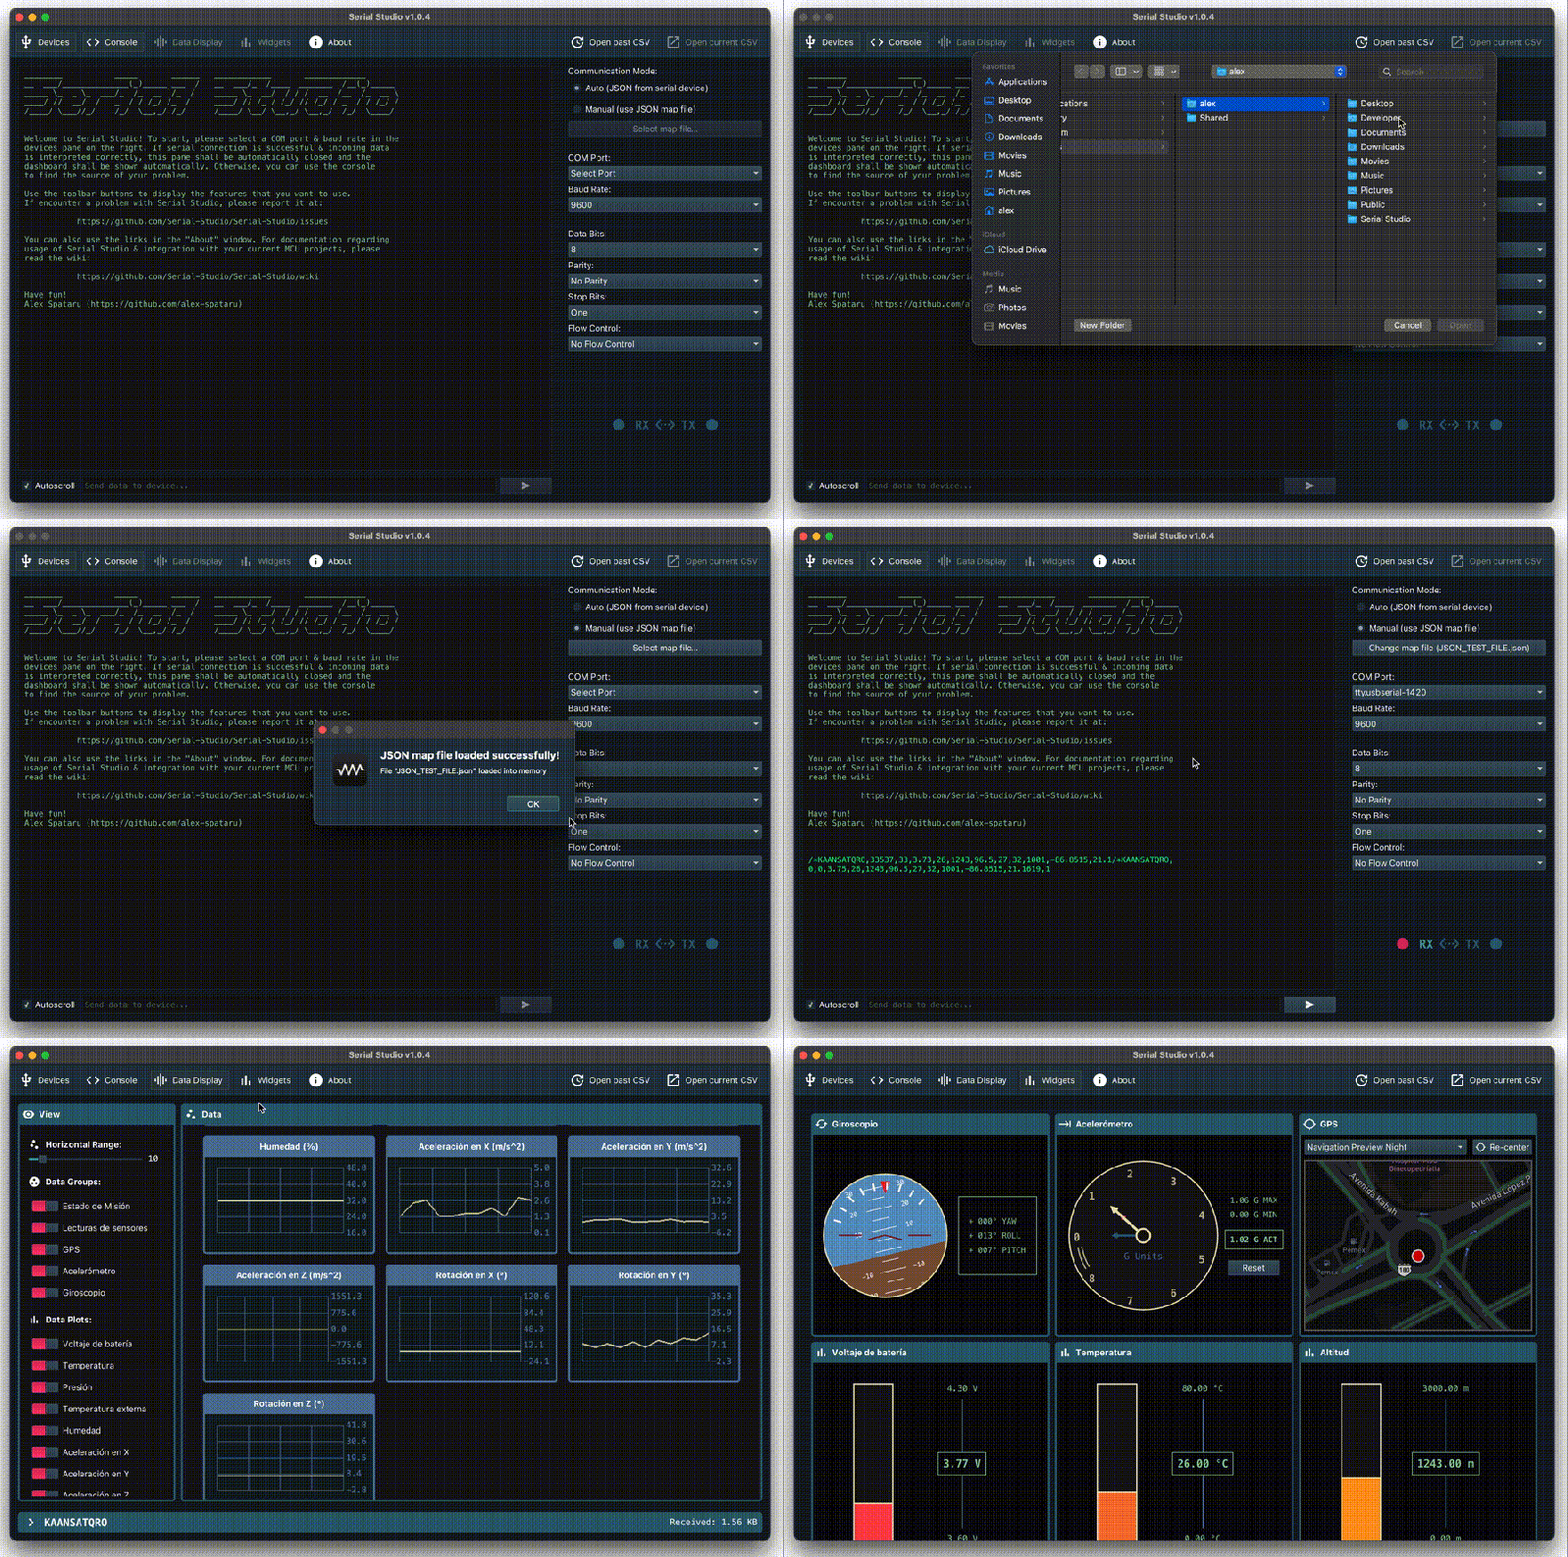
The only input required for Serial Studio to create a dashboard is a simple JSON structure specifying the data’s format, and how it should be grouped and displayed. Originally Serial Studio required all the JSON data to be sent over serial, which is fine for simple data but quickly becomes cumbersome for more complex applications. To solve this, [Alex] added a feature allowing the JSON document with the format information loaded from the computer, while only the data is sent over serial.
Serial Studio includes several visualization options, including raw line graphs, bar/level indicator, dial indicator, the artificial horizon for IMU data, or a map widget. It can also output the formatted data to a CSV file for further analysis in other software. A console window is also included for viewing raw data or debugging purposes. See the usage demo after the break.
We like Serial Studio’s ease of use and adaptability, and we’ll likely use it for our own projects in the future. It is compatible with Linux, Windows, and Mac thanks to the Qt framework, and the code is open-source and available on GitHub.
If you’ve ever watched one of the BPS.Space model rocket launch videos, you’ll know how critical data logging, visualization and analysis is for [Joe Barnard]’s work. Serial Studio is perfect for such applications, and [Alex] used it extensively for simulated satellite competitions at his university.

Post a Comment